Trading Pro Analytic
Algorithmic market analysis based on data. Financial market monitoring and trading signal analysis.

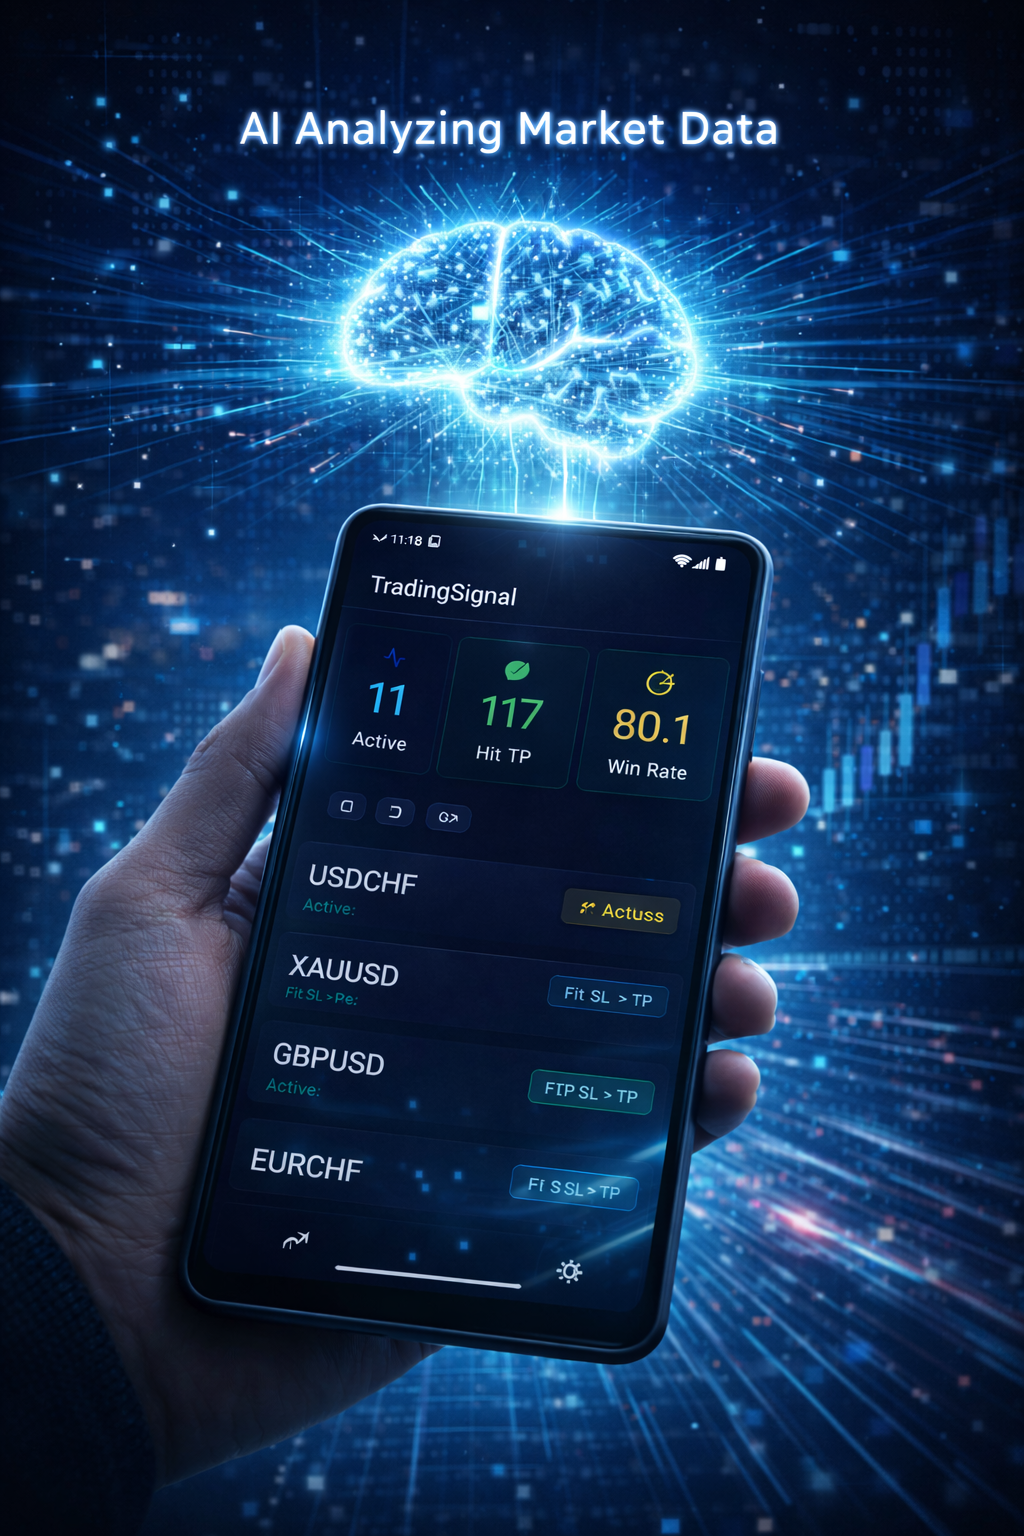
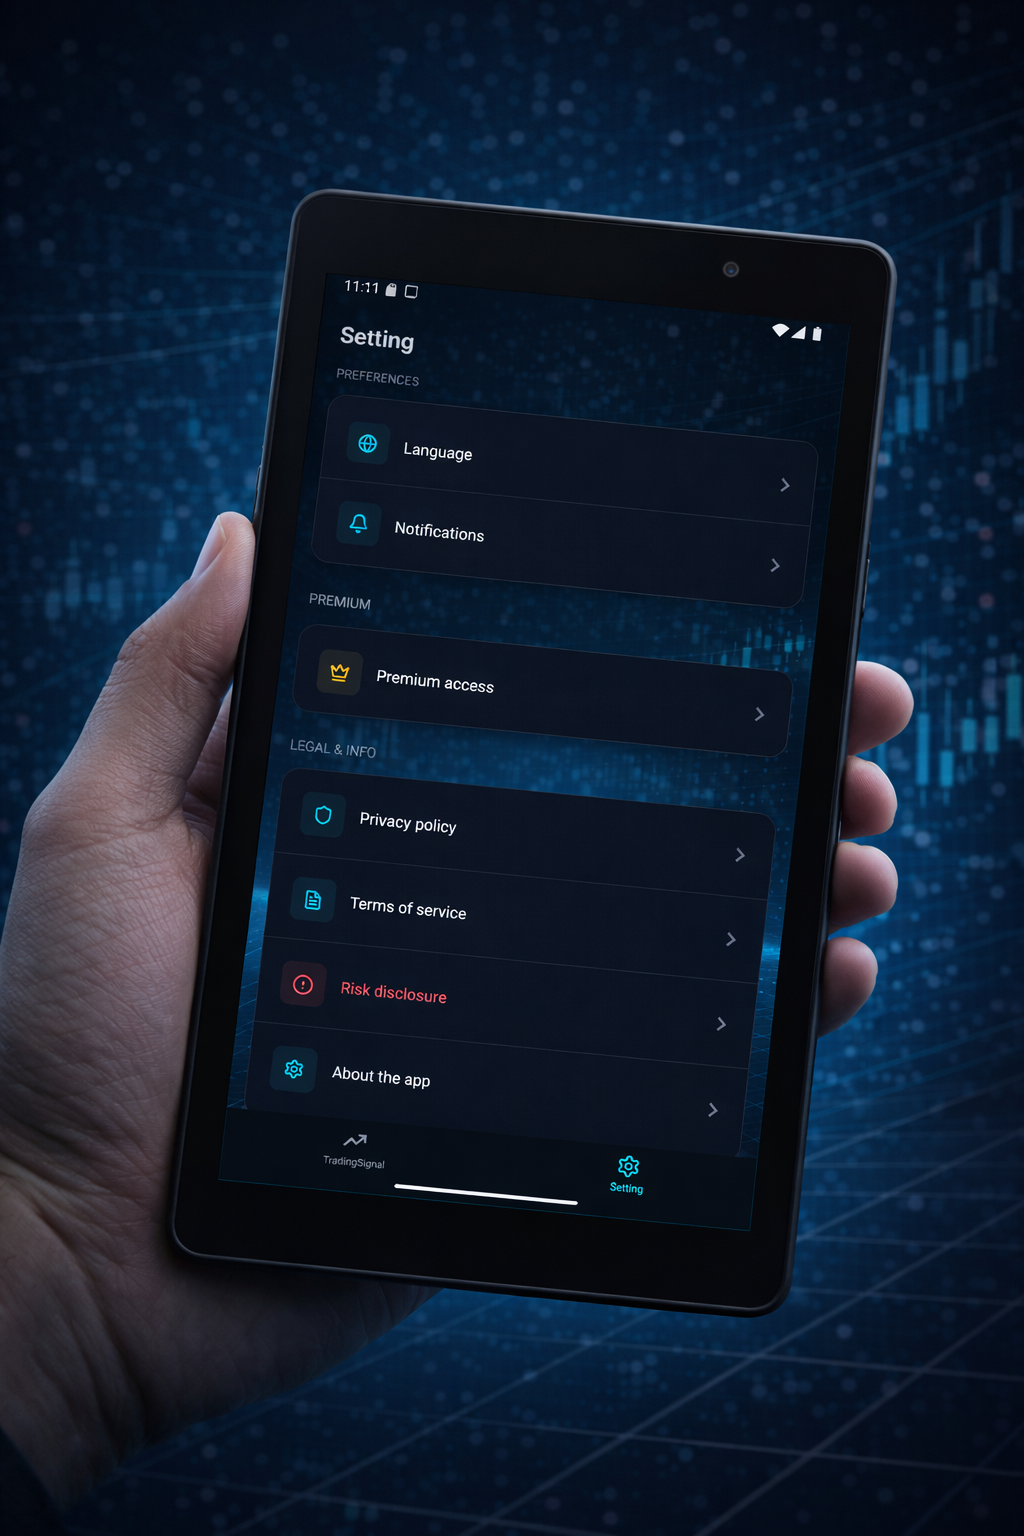
See the app in action
Modern interface designed for traders. All information at your fingertips.
STOP GUESSING. START TRADING.
AI-driven market logic
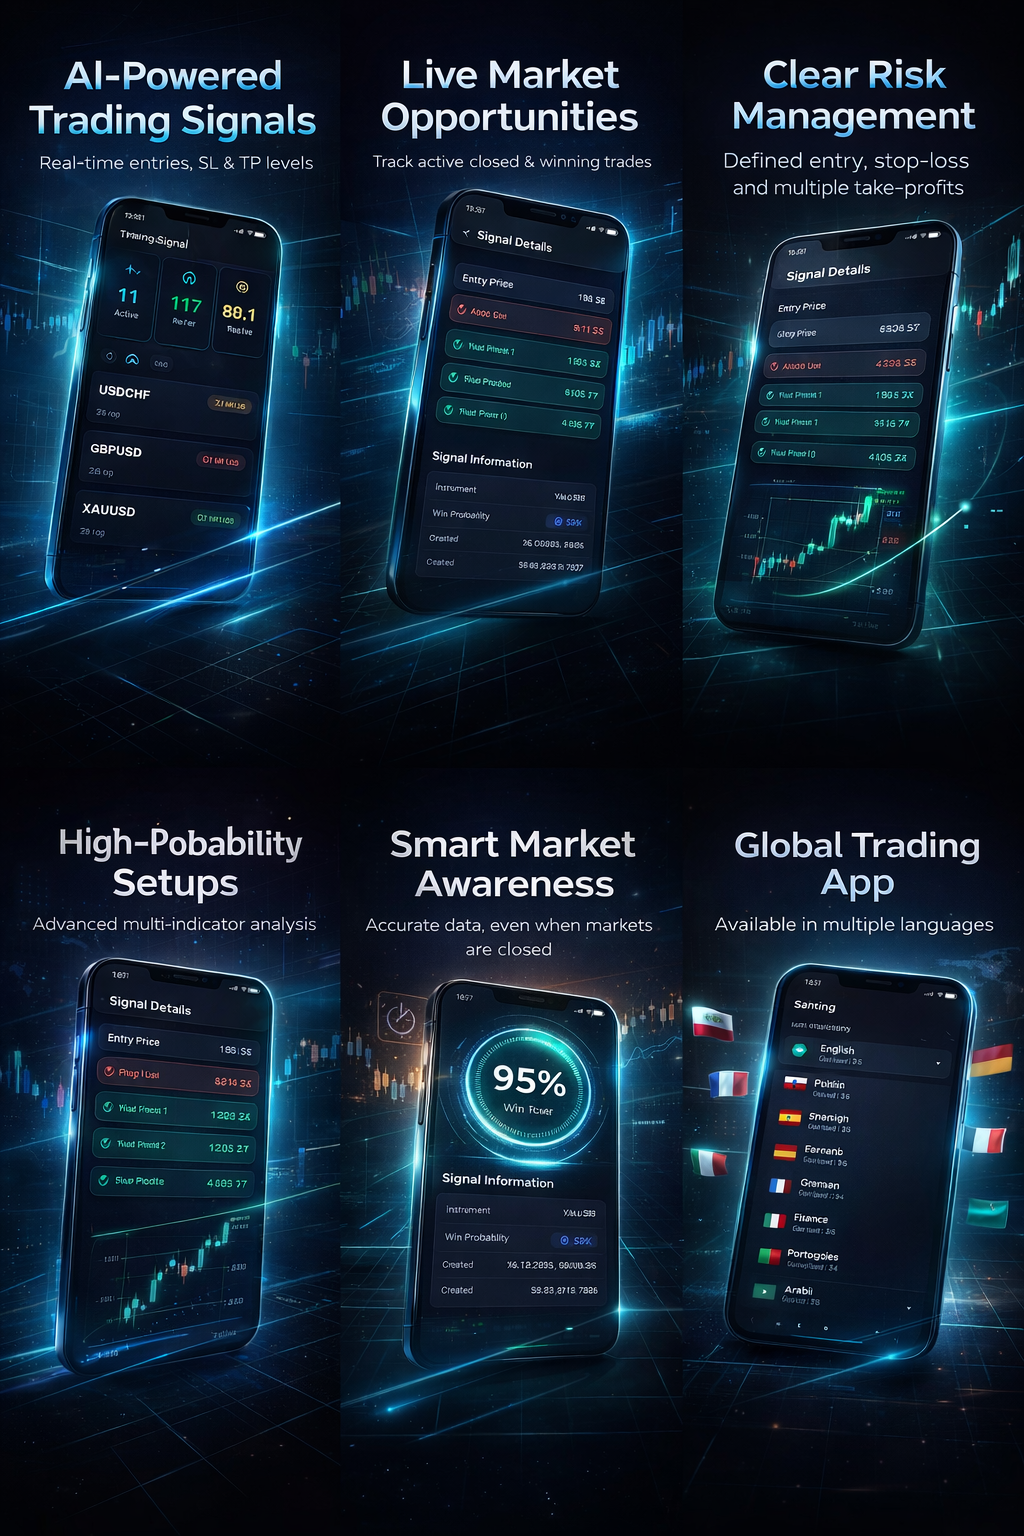
Don't guess - use signals based on advanced AI analysis. Each signal has precisely defined Entry, Stop Loss and Take Profit levels.
SECONDS MATTER
Instant push notifications
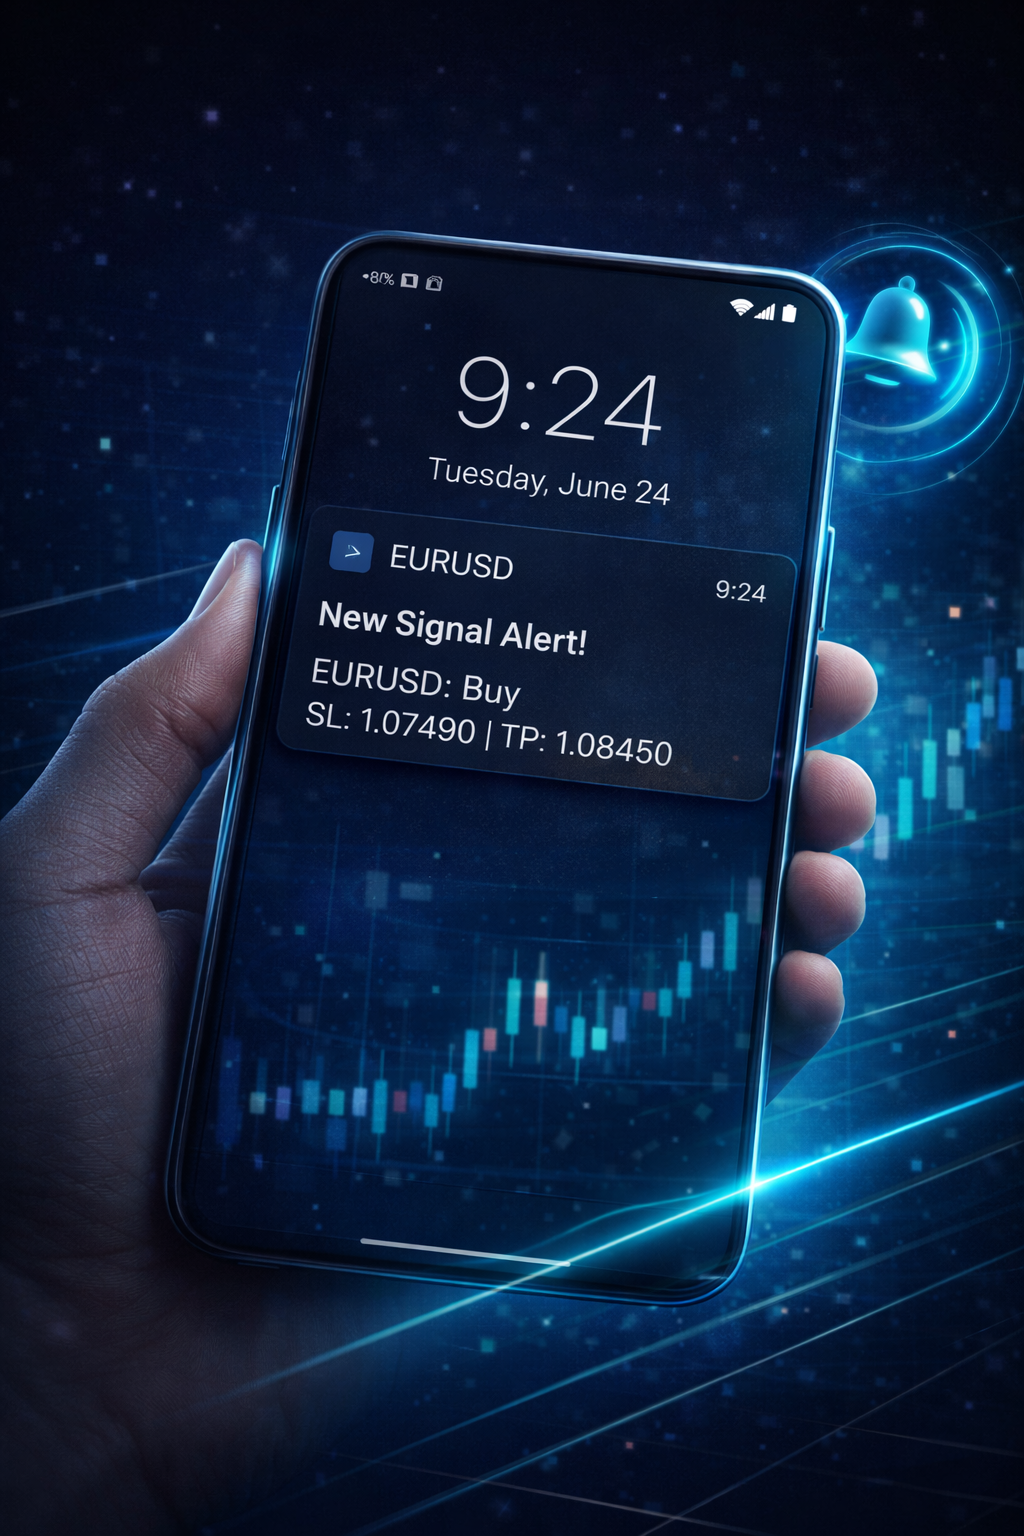
Receive instant push notifications about new signals. Don't miss any opportunity - every second matters in the market.
NO CHAOS. ONLY LEVELS
Entry, Stop Loss, Take Profits
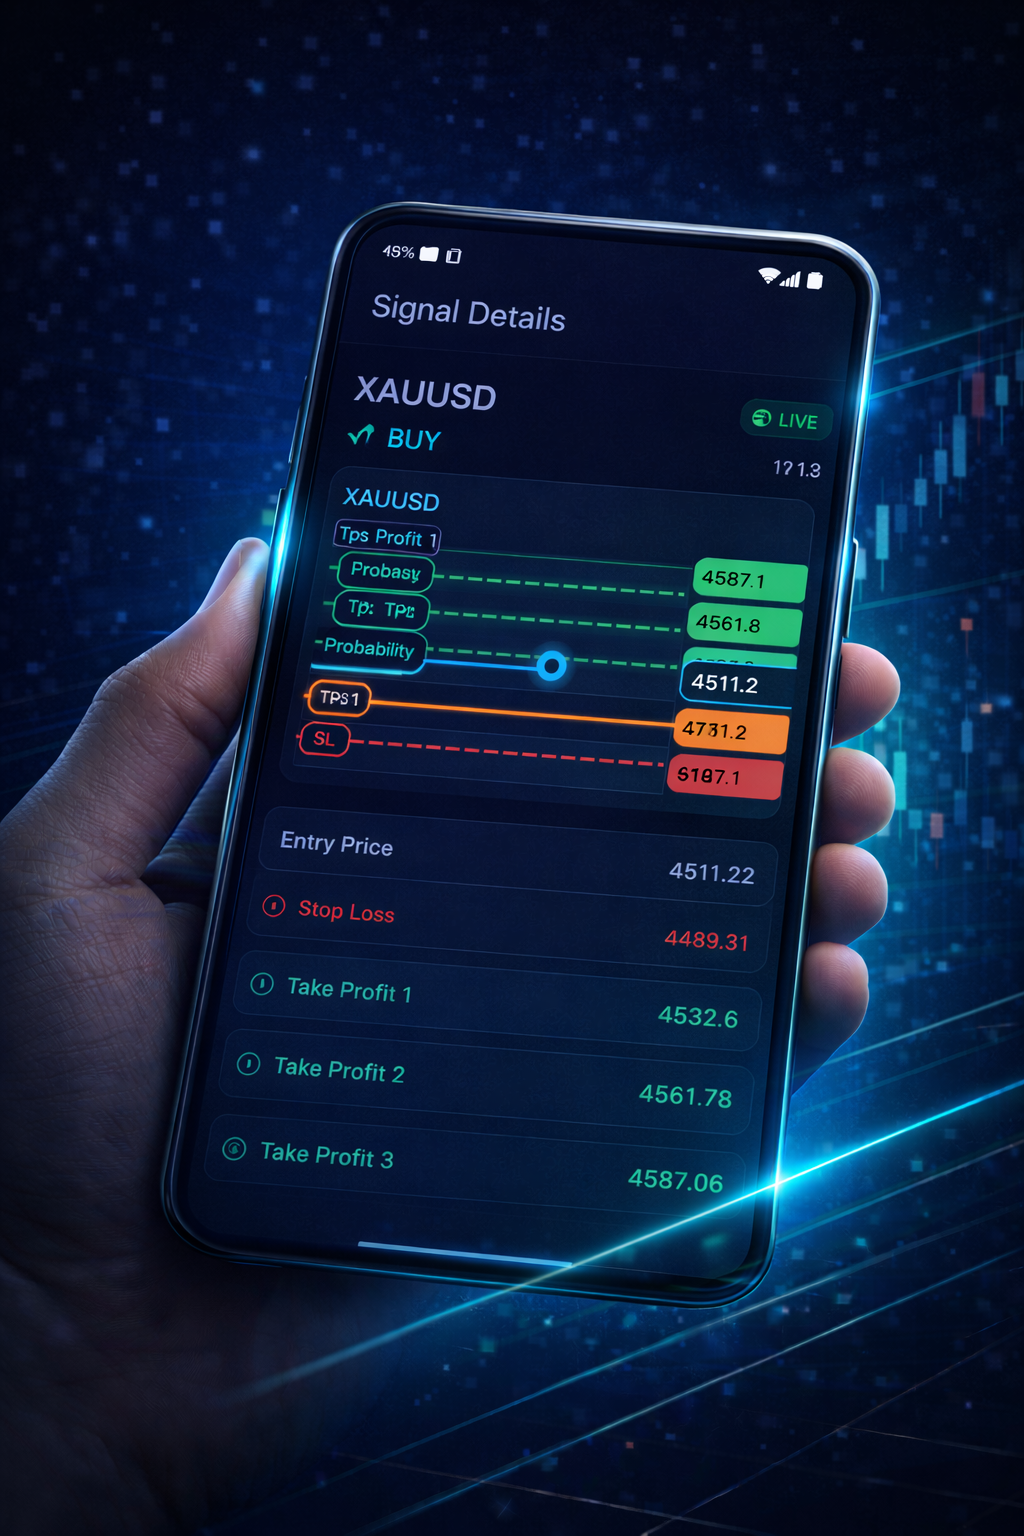
No chaos - only clearly defined levels. Each signal contains Entry Price, Stop Loss and three Take Profit levels.
PROBABILITY OVER EMOTION
Signals ranked by win probability

Signals are ranked by success probability. Make decisions based on data, not emotions.
REAL TRADES. REAL RESULTS.
Track hits, losses & win rates
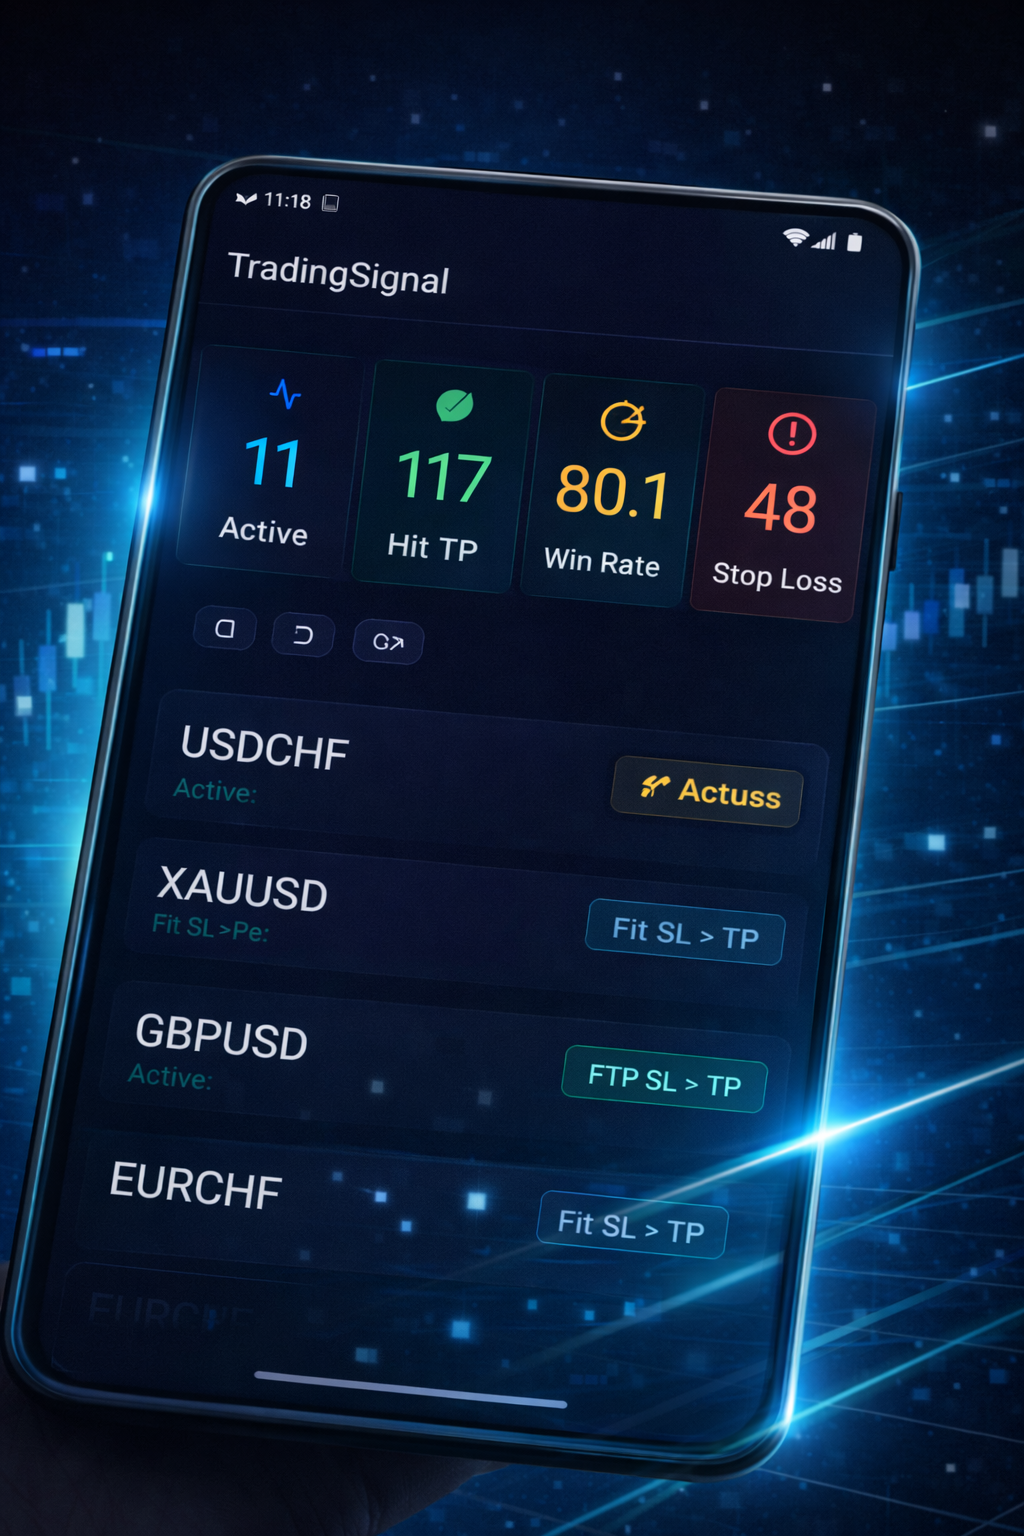
Track real results of your trades. Statistics show TP hits, SL losses and actual win rate.
SEE WHAT OTHERS CAN'T
Unlock premium signal details
Premium users have access to advanced signal details and additional analytical features.
Signals generated by AI learning in real time
An advanced machine learning system analyzes thousands of market patterns and automatically adjusts its predictive models based on real-world results.
AI System Architecture
A multi-layer deep learning model with an adaptive mechanism
Technical Analysis Layer
• Analysis of 50+ technical indicators simultaneously
• Identification of chart formations and candlestick patterns
• Detection of historical support and resistance levels
• Trend strength assessment across 5 timeframes
Market Sentiment Analysis
• Monitoring market volume and liquidity
• Analysis of price behavior in key zones
• Detection of anomalies and unusual movements
• Intermarket correlation (forex, indices, commodities)
Predictive Model
• LSTM neural networks for time-series data
• Ensemble learning – combination of multiple models
• Gradient boosting for decision optimization
• Monte Carlo simulations for risk estimation
Level Calibration
• Dynamic Entry calculation based on ATR
• Stop Loss adjusted to market volatility
• 3 Take Profit levels based on Fibonacci and market structure
• Risk–reward ratio optimization (target minimum 1:2)
How Does the System Calculate and Manage Risk?
STEP 1Volatility Analysis
The system calculates the Average True Range (ATR) for the last 14 periods to measure current instrument volatility. Based on this, it determines a safe Stop Loss distance that is neither too tight (frequent stop-outs) nor too wide (excessive losses).
STEP 2Entry and Stop Loss Determination
AI selects the optimal entry point based on key technical levels (support/resistance zones, EMA, Fibonacci). The Stop Loss is placed beyond the nearest market structure zone, with a safety margin based on ATR Ă— 1.5.
STEP 3Position Size Calculation
The system recommends a position size so that the potential loss (distance between Entry and SL) does not exceed 1% of capital. Formula: Lot size = (Capital Ă— 0.01) / (Distance to SL Ă— Pip Value)
STEP 4Take Profit Optimization
AI sets 3 TP levels based on the following criteria: * TP1 (1:1 R:R) – quick partial profit protection * TP2 (1:2 R:R) – main target based on market structure * TP3 (1:3+ R:R) – trend extension while maintaining direction
STEP 5Probability of Success Assessment
The AI model assigns each signal a confidence percentage (70–95%), calculated based on: alignment with higher-timeframe trends, indicator strength, chart pattern quality, and historical performance of similar setups. Only signals above 70% are published.
Why Are the Signals So Effective?
âś“ Multifactor analysis: The system does not rely on a single indicator but on consensus from multiple data sources
âś“ Real-time learning: AI analyzes the effectiveness of each signal and adjusts model parameters dynamically
âś“ Low-quality filtering: Only signals meeting strict criteria are published
âś“ Market condition adaptation: The model recognizes different market phases (trend, consolidation) and adjusts strategy
âś“ Risk management: Each signal has precisely defined SL/TP levels based on market structure
Professional Economic Events Calendar
Monitor the most important economic events affecting financial markets. The system automatically filters key announcements and warns about increased volatility.
Economic Calendar Integration
Full synchronization with global economic events
High-Impact Events
• Central bank decisions (Fed, ECB, BoE, BoJ)
• NFP – Non-Farm Payrolls (first Friday of the month)
• CPI – Consumer Price Index (inflation)
• GDP – Gross Domestic Product (economic growth)
• Retail Sales
Medium-Impact Events
• Interest rate decisions (smaller economies)
• PMI – Purchasing Managers Index (manufacturing and services)
• Unemployment Rate
• Trade Balance
• Industrial Production
Advanced Calendar Features
Push Notifications
Receive alerts 30 minutes before major announcements. The system automatically warns about upcoming events affecting your open positions.
Intelligent Filtering
Select which currencies and event categories matter to you. The app hides irrelevant announcements and shows only those impacting your portfolio.
Historical Analysis
Review how the market reacted to similar events in the past. The system shows average volatility and price direction following specific announcements.
Risk Warnings
The system automatically marks periods of increased volatility and suggests refraining from opening new positions before and immediately after major announcements.
Calendar Integrated with AI Signals
âś“ Automatic assessment: AI considers upcoming events when generating signals
âś“ Risk level adjustment: Before major announcements, the system recommends smaller position sizes
âś“ Temporary suspension: During NFP, Fed decisions, or CPI releases, the app does not publish new signals
âś“ Post-news trading: After announcements, AI rapidly adapts models to new conditions and publishes signals aligned with the new trend
What Sets the App Apart?
Multidimensional Analysis
The system analyzes multiple indicators instead of relying on single signals
Signal Filtering
Automatic elimination of low-quality signals and low-predictability environments
1% Risk Structure
Clear Entry, Stop Loss, and Take Profit levels for every signal
Update History
Complete signal update history with transparent TP/SL outcomes
Real Statistics
Statistics based on real market events, not simulations
Risk Management
Tools supporting responsible capital management
Important Information
The app does not provide investment advice or financial consulting
The app does not guarantee financial results or profits
All investment decisions are made solely by the user
The app is informational and analytical in nature
Operating Model
Decision-support system
Trading-Pro-Analys is an advanced analytical system designed with a layered architecture:
Market Data Sources
Data retrieval and normalization from multiple financial markets
Analysis and Filtering Layer
Algorithms processing data and generating signals
Statistics Layer
Event history and signal performance analysis
Presentation Layer
Mobile and web interfaces for users
The system does not hold user funds and does not execute trades.
Subscription Terms
Subscription Terms
Nature of the Subscription
The subscription provides immediate access to premium features. Access is activated at the moment of purchase.
Trial Period
The app may offer a 7-day trial period, which begins immediately upon subscription activation.
Cancellation
The subscription can be canceled at any time via the Google Play account. Access remains active until the end of the paid period.
Refunds
After subscription activation and immediate access to premium content, refunds are not available.
Google Play Compliance
Google Play Compliance
No profit guarantees
No investment advice
Clear subscription terms
Transparent privacy policy
Copyright and Intellectual Property Protection
All content, graphics, images, and materials on this page are protected by copyright law.
Any copying, reproduction, distribution, modification, or sharing of content, graphics, images, mobile app screenshots, or other materials available on this page without written consent from the owner is strictly prohibited.
Intellectual Property Protection
All trademarks, logos, product names, user interfaces, mobile app screenshots, and other visual elements are the property of Trading Pro Analytic or their respective owners and are protected by copyright and other intellectual property laws.
Prohibited actions:
- Copying, downloading, or saving graphics, images, or screenshots without permission
- Sharing, publishing, or distributing visual materials from this page
- Modifying, editing, or processing any content or graphics
- Using materials for commercial or promotional purposes
- Creating derivative works based on content or graphics from this page
© 2026 Trading Pro Analytic. All rights reserved. Unauthorized use of any materials from this page may result in civil and criminal liability under applicable law.
For questions regarding the use of materials, please contact: support@trading-pro-analytic.com